
Training Insights – By Marcos A. Carreras, Ph.D.
Trainers today rely on instruments to gather valuable data
Surveys and other measurement tools are indispensable in today’s data-driven world. Organizations, educators, researchers and various professionals rely on these instruments to gather valuable information, assess performance and make informed decisions.
In this article, we explore the importance of Kirkpatrick level one surveys, and the effectiveness of performance-focused questions. We’ll share a case study on dimensions for assessment of training impact and the significance of standardizing dimensions to generate standard and actionable insights. Finally, we’ll talk about the importance of executive summaries and dashboards to present our data results.
Level One Surveys: Laying the Foundation
The Kirkpatrick Model is a widely recognized framework for evaluating training and development programs. It consists of four levels, each representing a different dimension of assessment. Level one focuses on reactions, measuring participants’ immediate response to the training experience. It gauges factors such as satisfaction, engagement and relevance.
Level one surveys serve as the foundational step in data collection, particularly in organizational and educational settings. These surveys typically encompass basic information about participants, such as demographics and general feedback. Level one surveys lay the groundwork for deeper analysis by providing context and understanding the characteristics of the surveyed population.
Level one surveys are commonly referred to as smile sheets but can be much more than simple questionnaires seeking participant satisfaction with a program. While smile sheets do measure participants’ immediate reactions and sentiments toward the learning experience, they can be enriched to collect valuable data beyond mere smiles using performance-focused questions.
The Power of Performance-Focused Questions
Traditional Likert type (agree-disagree) questions primarily focus on participants’ satisfaction and engagement, but they fail to address the crucial aspect of performance improvement. Performance-focused questions revolutionize this evaluation process by introducing questions specifically designed to measure participants’ learning outcomes and the application of newly acquired knowledge and skills.
This paradigm shift in approach allows for a more holistic understanding of the training’s impact on individual and organizational performance. According to Will Thalheimer, Ph.D., performance-focused questions have four key components that make more robust level one surveys:
- Learning Outcomes Assessment: Performance-focused questions, when incorporated in a survey, assess participants’ grasp of the training content. By measuring the level of knowledge gained during the program, trainers can determine the effectiveness of their instructional methods and identify areas that require further reinforcement.
- Application of Knowledge and Skills: These questions also inquire about participants’ ability to apply the newly acquired knowledge and skills in their work or real-life scenarios. This critical aspect directly links training outcomes to on-the-job performance, providing trainers with valuable insights into the program’s practical impact.
- Barriers and Facilitators: Performance-focused questions can also be aimed at uncovering the factors that hinder or support the transfer of learning. Identifying these barriers and facilitators helps trainers tailor their approach to overcome obstacles and enhance knowledge application.
- Self-Assessment and Goal Setting: Participants’ self-assessment of their performance and goal setting for future improvement can also be assessed with performance-focused questions. Using these types of questions for these elements promotes individual accountability and provides trainers with a roadmap for personalized support and development plans.
Case Study: A Journey of Process Improvement
When I join an organization, one of the first steps I always do is to spend time learning about their culture, ways of working and understanding of “pain points. ”One of the biggest issues explained to me by stakeholders was that the existing measurement strategy was felt as “stuck.”
Basically, surveys were coming from everywhere, there was no standardization of questions asked and no actual strategy on reports, analytics or presenting data(for example, executive summaries and dashboards), which didn’t allow effective sharing with leadership and other stakeholders. This is when it was decided that a survey and measurement theoretical framework needed to be implemented.
A theoretical framework holds immense importance. It provides a structured and organized approach to understanding, analyzing and interpreting information. It serves as a roadmap that offers a systematic way to define and organize key concepts and ideas. It provide a shared language and understanding among users, reducing ambiguity and enhancing communication.
A robust theoretical framework increases the validity and reliability of data. It helps ensure that the data collection methods, analysis and interpretations align with the established key performance indicators (KPIs) or dimensions, reducing the risk of random or biased results or misinterpretations. It builds on the collective knowledge and with standardized dimensions, allows data comparison and trending.
Exploring Dimensions
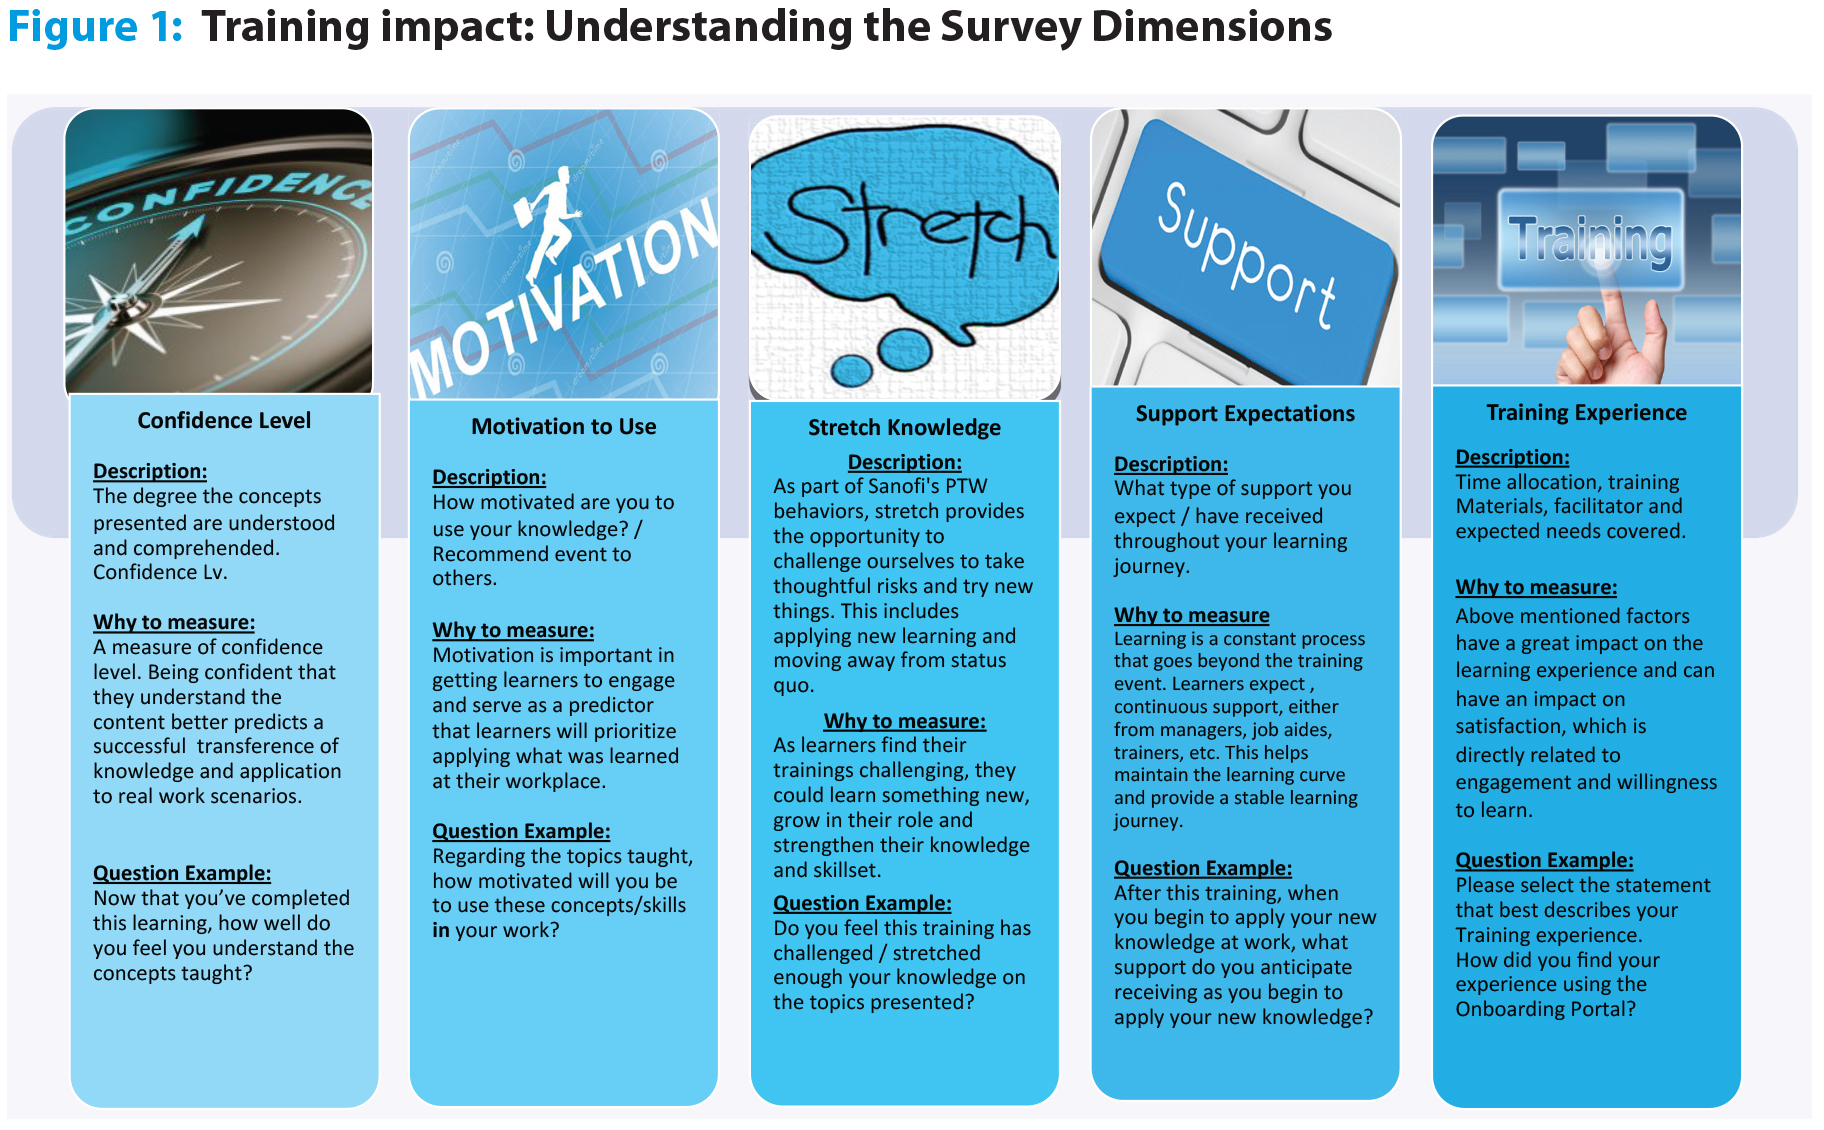
Our theoretical framework was based on dimensions, which relate to organizational KPIs and objectives. The goal was to have dimensions that were impactful to the business, actionable by the users, easy to understand and quantifiable. Our organization came up with the following five dimensions for our measurement strategy (See Figure 1)
- Confidence level: Assessing an individual’s confidence in their abilities is crucial to understanding how well they can apply their skills. Confidence impacts performance and influences decision-making, making it essential to gauge and address any discrepancies.
- Motivation: Motivation is a key driver of success in various contexts. Evaluating individuals’ motivation levels helps identify factors that boost engagement and productivity, leading to more effective strategies for goal attainment.
- Stretching the knowledge: As individuals encounter challenges that require applying their knowledge, their capabilities are put to the test. Understanding how well they can stretch their knowledge beyond routine tasks reveals their adaptability and problem-solving skills.
- Support needed and received: Identifying the support individuals require and receive from peers, mentors or supervisors offers valuable insights into the effectiveness of support systems. This data aids in building stronger support networks and fostering a collaborative environment.
- Training experience: Assessing participants’ training experiences reveals the efficacy of educational programs or professional development initiatives. It helps determine whether the training meets its objectives and if improvements are necessary for enhanced outcomes.
Standardizing these dimensions is essential to ensure consistency and comparability of survey results. By establishing clear definitions and measurement scales for each dimension, survey creators can avoid ambiguity and interpretation variances. Standardization allows for easier analysis of data and facilitates comparisons between different groups or time periods, ultimately leading to more accurate conclusions and actionable insights.
Measurement strategies should also be flexible enough to change when necessary. There can be several triggers for change:
- Revision or updates in organizational objectives, dimensions or KPIs.
- Revision of measures that are considered under control or constantly green.
- Introduction of continuous improvement opportunities.
- Just to enhance the customer service experience.
A revision cycle was included as part of the strategy to accomplish this goal. (See Figure 2)
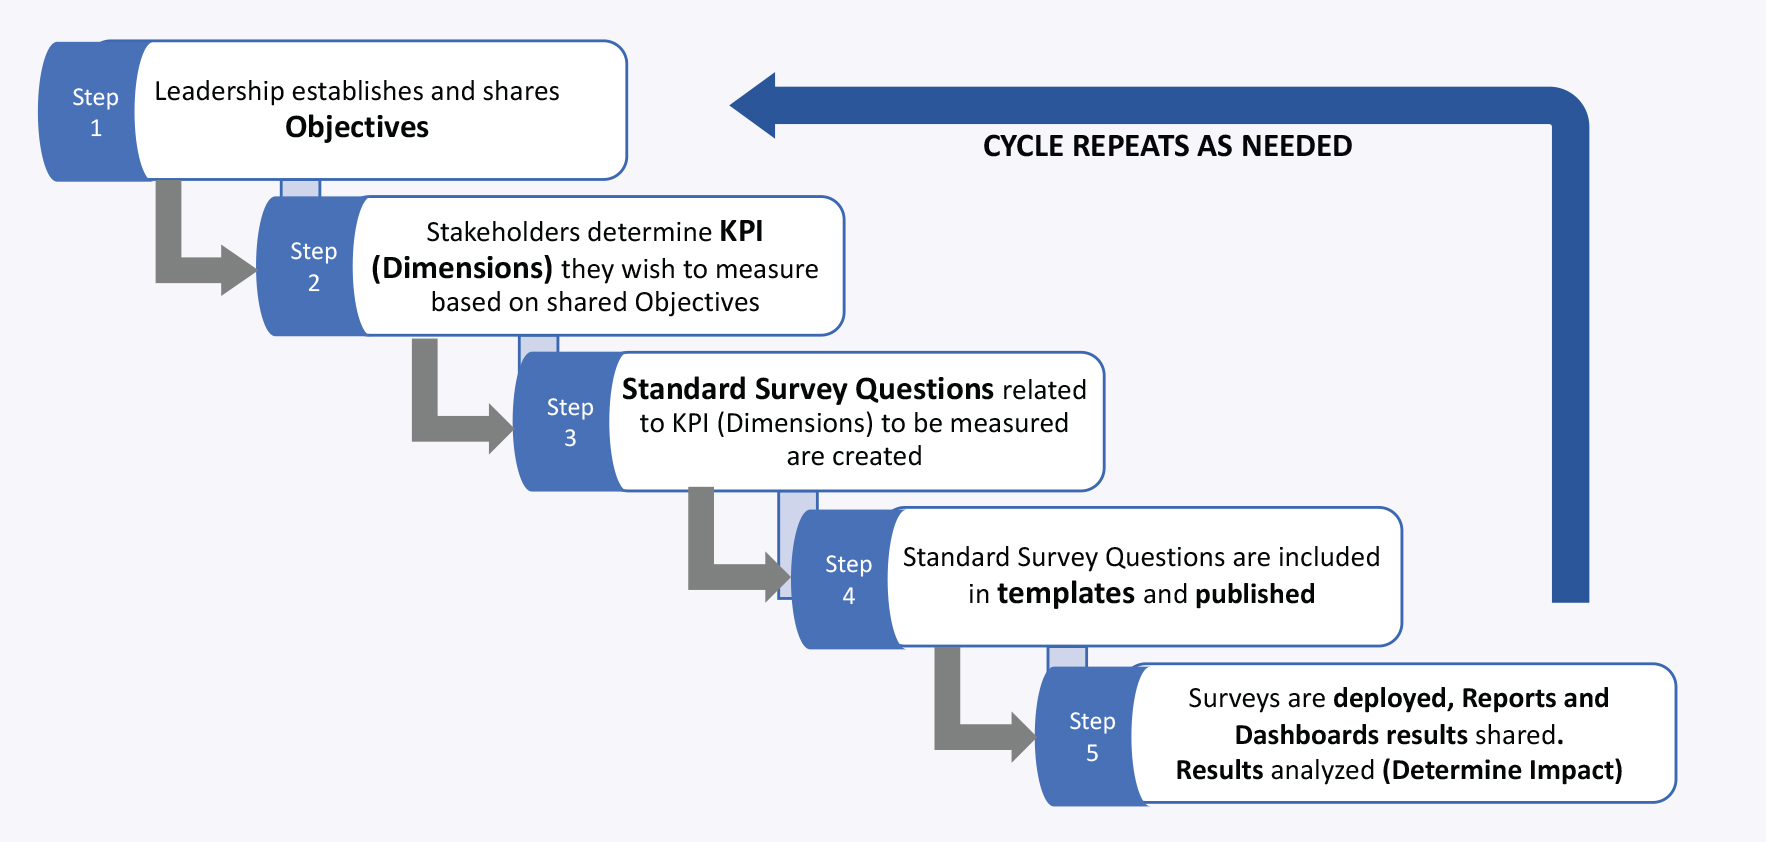
Figure 2: Measurement KPI (Dimensions) and Survey Revision Cycle
Utilizing Dashboards
In the ever-evolving landscape of data-driven decision-making, the role of dashboards has become increasingly vital. Dashboards serve as visual representations of survey and measurement data, presenting complex information in a user-friendly and accessible manner.
One of the primary advantages of dashboards is their ability to visualize data effectively. Instead of sifting through spreadsheets and raw numbers, stakeholders can access clear, concise and interactive graphical representations. Charts, graphs and heatmaps are among the many visualization options available in dashboards, enabling users to, at a glance, understand trends, patterns and relationships.
Dashboards offer real-time or near-real-time updates, allowing users to access the most current data available. This dynamic feature is particularly valuable in dynamic environments, where decision-making depends on up-to-date information. Users can monitor dimensions and track progress toward goals in real time, enabling swift action and intervention when necessary.
They can be tailored to cater to specific audiences, providing relevant insights to different stakeholders. Managers, executives or peers may require varying levels of detail and metrics. By customizing dashboards to meet the unique needs of each audience, data-driven discussions become more focused and effective.
Conclusion
Surveys and measurements are potent tools that empower organizations with valuable data to drive informed decision-making. Kirkpatrick level one surveys provide the groundwork for deeper analysis, while performance-focused questions offer a deeper and more targeted insight on the responses. By considering dimensions like confidence, motivation, knowledge stretching, support and training experience, survey creators and analytics professionals can extract comprehensive data to shape effective strategies.
Moreover, standardizing dimensions ensures consistency and comparability, enhancing the reliability and utility of survey results. In harnessing the power of surveys and measurements, individuals and organizations can pave the way for growth, development and success.
As leaders use the data from surveys and measurement tools for decision-making, dashboards emerge as indispensable tools to present data with clarity and impact. By visualizing data, providing real-time updates and customizing for specific audiences, dashboards empower stakeholders to identify trends, anomalies and actionable insights efficiently.
The collaborative nature of dashboards fosters communication among teams, leading to more effective data-driven discussions. Ultimately, the integration of dashboards into the survey and measurement process enhances the utilization of data, propelling organizations and professionals toward success.
 Marcos A. Carreras, Ph.D. is an industrial organizational psychologist and senior manager SPC commercial training, for Sanofi. Email Marcos at marcos.carreras-vargas@sanofi.com.