Diagramming Sales Calls
FEATURE STORY – By Jason C. Elmore
At one point in my career, I was a manager of sales training and professional development. When I trained new salespeople, we roleplayed a lot! I believe it is the best preparation for the real job, and I worked hard to keep the objections fresh and current and the scenarios realistic.
Nobody shows up to TOPGUN fighter pilot training in Fallon, Nev., and says, “Oh, I just do poorly in role-plays. But I’m awesome in front of the enemy. Just let me at ’em.”
In role-plays, the best setup is a “customer,” a salesperson and one or two observers. A timer is set for six to eight minutes. The job of the observers (and the pseudo-customer, if they can talk and take notes at the same time) is to diagram the call.
Unlike most sales role-plays, in the five minutes of feedback after the exercise, I don’t ask, “What did they do well?” (That question, while very gentle on the learners’ egos, leads to vague answers and little insight.) Instead, at the end of the call I ask, “Where did the call take a turn?” The goal of the new hires is to determine exactly where the call took a turn for the better or the worse. They need to identify exactly what was said, the dynamic or reaction it generated, and why it succeeded or failed with the customer.
To help new hires identify “the turn,” I teach people to diagram calls.
The Structure
Every call should have an introduction and an agenda, and careful attention must be paid to observe how well these two critical components were delivered to facilitate the call.
The call should start provocatively with an important fact that provides insight about the dynamics affecting the customer’s business. Then it must teach something. This is also carefully noted on the diagram.
The interaction should then progress to questions regarding the customer’s understanding and reaction to the new information just introduced. Any questions are logged into the diagram, and the answers are recorded by indenting on the next line immediately below.
If the next question is directly related to the answer, we indent on the next line again and continue. If the question is not related to the previous answer and relates to a new and separate idea, we do not indent but rather return to the left margin on the next line.
In this way, the Q&A goes until the crux of the issue is revealed, at which time the salesperson is in a position to present the solution they have to offer, handle remaining objections and close. The interesting thing is that the turning point in the call is literally the turning point on the diagram on the paper!
Here’s an example of the framework of a call:
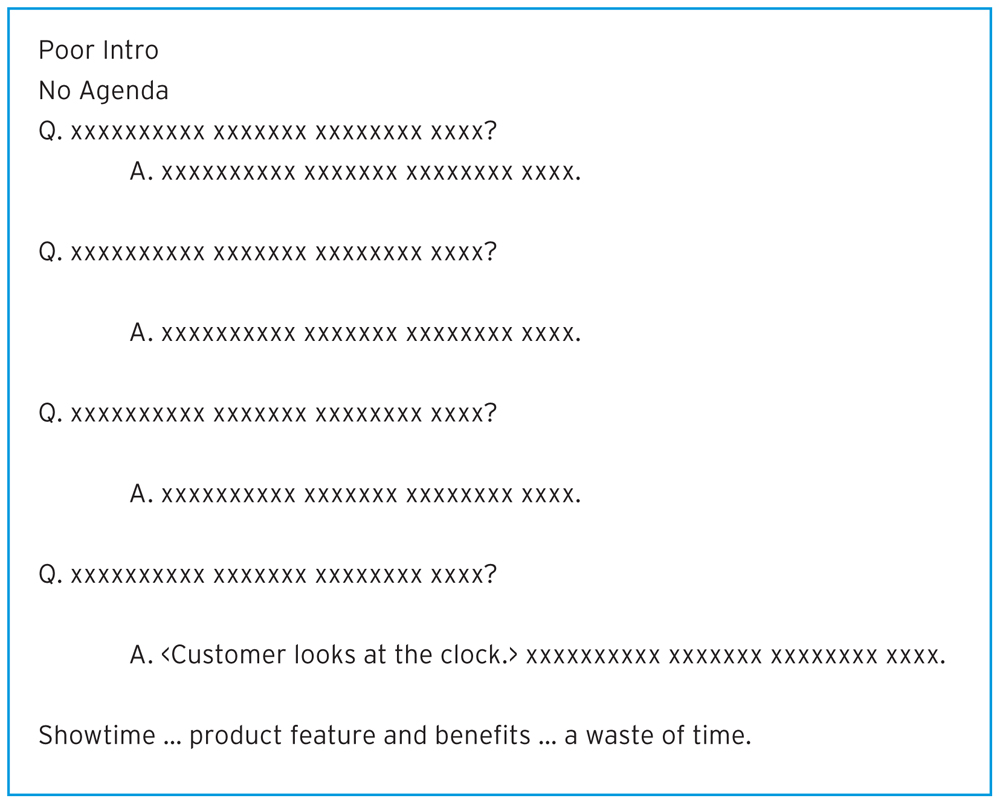
Figure 1. Basic Framework Sales Call Diagram
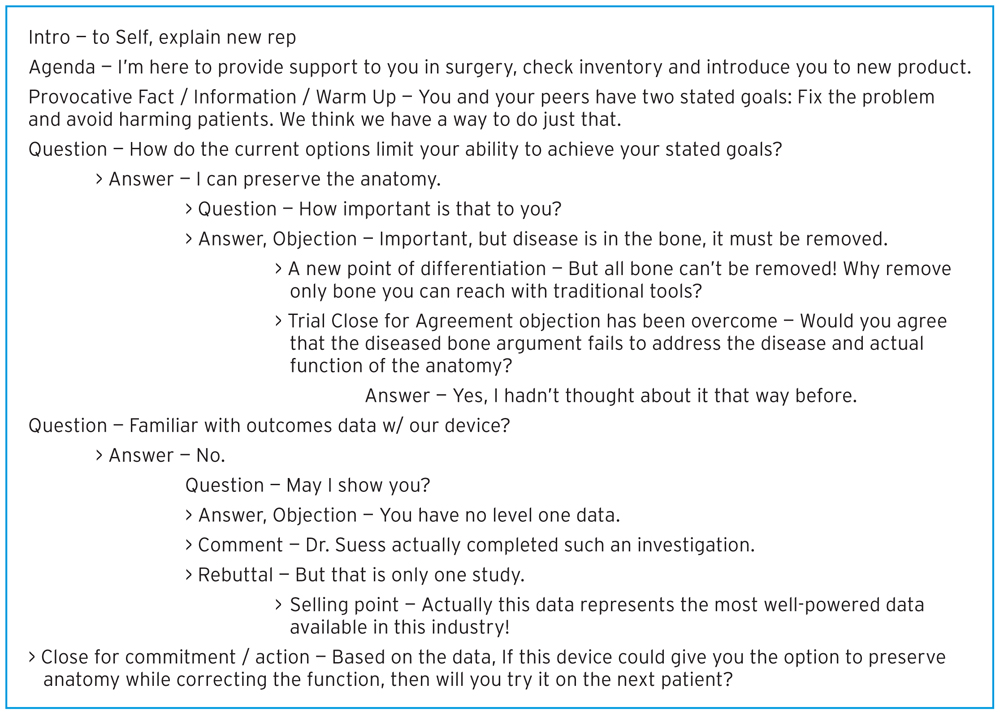
Figure 2. Specific Example Sales Call Diagram
Analyzing Results
Diagramming calls is a great exercise to practice with new employees. I continually emphasize the need to take notes as salespeople. This is much more, however, than taking notes, and it produces a much better methodology for analysis of success and failure.
It’s a fantastic tool in the field for salespeople, who rarely have the benefit of a second set of eyes on their engagements with customers — if they can master the ability to diagram and conduct sales calls concurrently. Admittedly, it’s tough and takes practice. But elite salespeople can do it.
I find the toughest thing to do is to diagram a sales call while running a role-play as the customer. But it can be done with great results!
At the very least, sales managers and sales trainers need to utilize this framework to capture and analyze the call during follow-up conversations.
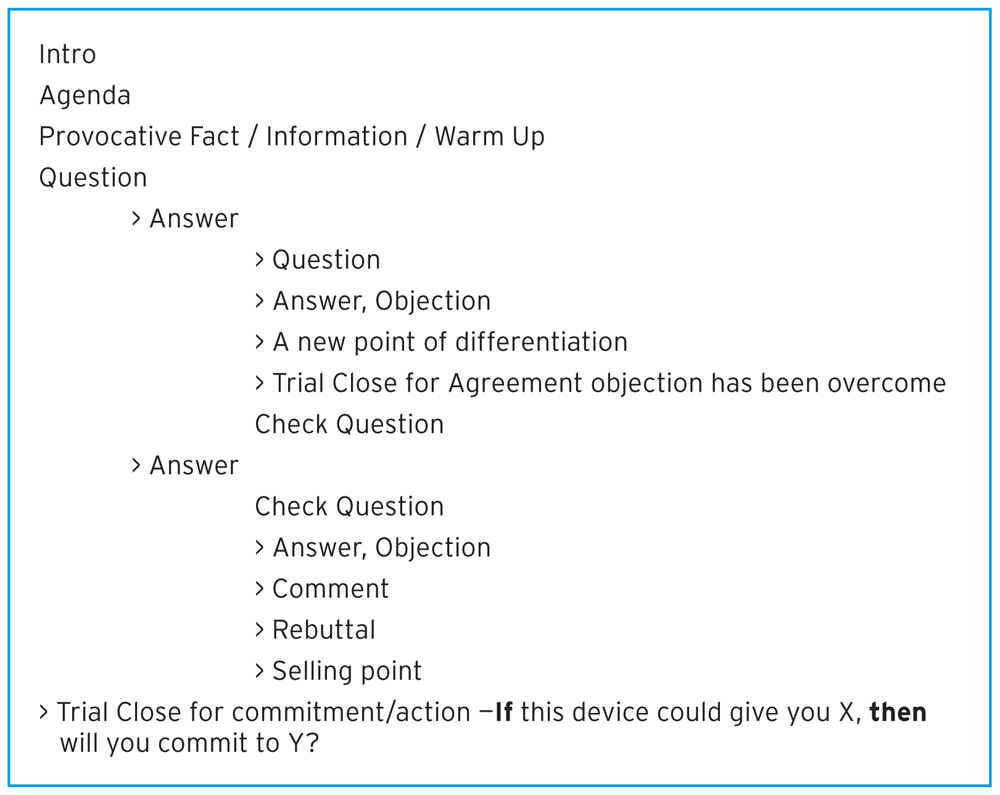
Figure 3. A Picture of Failure
The diagram above (Figure 3) is the picture of failure: 20 questions going nowhere and clinging to the left margin is not the idea. There is no “turn”; there is simply an awkward and abrupt end to aimless questions and a quick shift to a “features and benefits” presentation of the device or service that was not clearly connected to any value propositions.
Inevitably, the call crashes and burns, resulting in a frustrated representative who failed to gain any traction or close for agreement on the value of their solution.
It’s not pretty to watch someone crash and burn with a customer. It shows up pretty easily in the first five minutes of the call on the diagram. Once you understand that pattern, alarm bells and red flags can become associated with insights about the pattern, and complete disasters can be prevented in the future.
Conclusion
Failure is found straight down the page. Success indents across the page, identifying the underlying objections and closing for commitment.
Elite execution demands that you master the ability to diagram your interactions and identify where the call took a turn, for better or for worse.
Jason C. Elmore is senior manager, sales training & development, for Teleflex. Email Jason at jason.elmore@teleflex.com.