Are You Operating by Org Chart?
LEADERSHIP / MANAGEMENT DEVELOPMENT – By Kristin Scott
We often receive requests from learning & development (L&D) leaders to restructure their departments. And sometimes, it’s from the same client every few years. These requests usually include specific details such as looking at the current org chart, moving people around, changing titles and maybe adding or deleting a function.
What’s concerning these leaders are burned-out staff, high turnover, dissatisfied stakeholders, high spending on suppliers, missed deadlines and unfinished projects. These problems are symptoms and signals of underlying operational issues, but none will be eradicated or solved by moving boxes around on a sheet of paper.
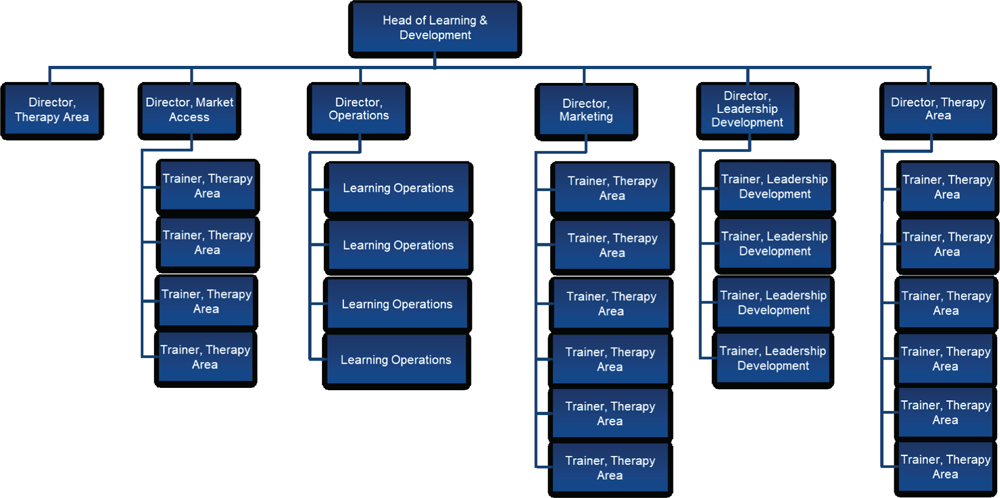
Regardless of where you work or where you are on your functional area’s org chart, you can see clearly what the chart is designed to convey: names, titles, reporting structure, seniority, department functions and sometimes vacancies.
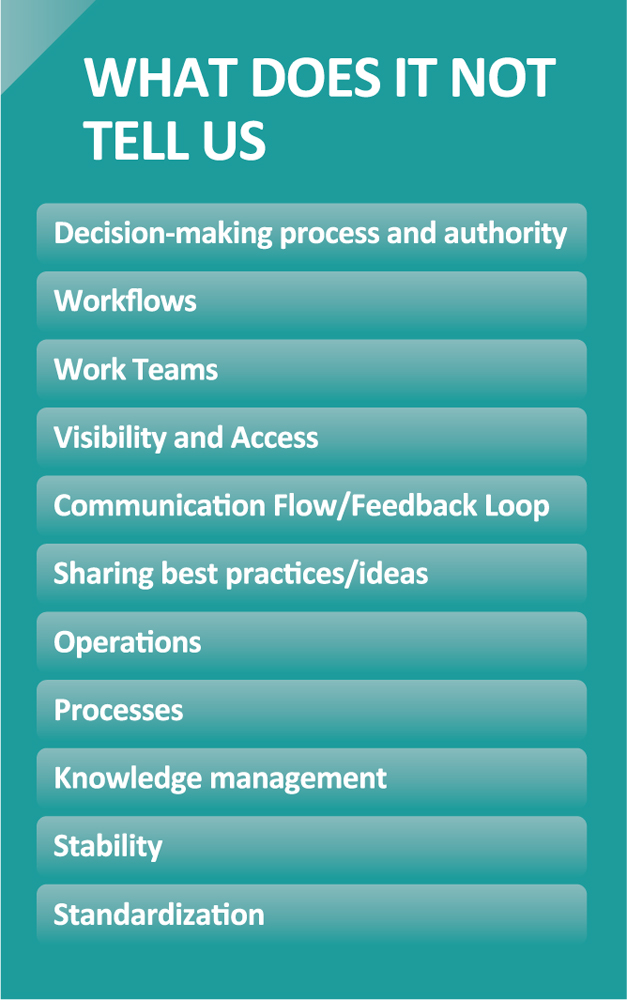
What you cannot see is how people and teams work, communicate, make decisions and share and receive ideas and best practices. And yet, this org chart, with all its limitations, is dictating and ultimately controlling these critical dynamics.
Org charts are dictating how:
- Communications happen (or not).
- Decisions are made (not always objectively or timely).
- Processes are designed (or not).
- Staff are onboarded (or not).
Resulting in:
- Teams in silos with poor horizontal or peripheral vision.
- Duplication of efforts and tasks.
- Innovations not being shared or scaled.
- Mixed messaging to key stakeholders.
- Frustrated and burned-out staff.
- Overspending on multiple suppliers.
- Loss of institutional expertise and intellectual capital.
- Inconsistent quality of learning and delivery.
- Poor global integration and execution.
- Inability to track and measure impact.
- Launches not hitting targets.
 Our benchmarks continuously reveal that operational dynamics significantly impact productivity, efficiency, communications, staff development, etc. To capture dynamics and forces that impact L&D organizational operations, processes, workflow optimization, efficiency and productivity, as well as validate some additional assumptions, we surveyed our network.
Findings and Results
As L&D teams grow (leaders having greater than five direct reports), more are structured and operating in silos by franchise and/or field team. They report “somewhat to mostly clear” decision-making authority. They have higher redundancies in tasks, and staff with less agility to flex according to needs. They report greater than 11% turnover and more roles intentionally designed to be transitional or rotational. Not surprisingly, they also have more full-time equivalents than smaller teams, filling an important need.
Also, 78% report average time in L&D roles is between one and three years, though the majority are not intentionally designing for transitional roles.
What is the relevance of average time in L&D roles?
Transitional/rotational roles often expose lack of operational dynamics because they’ve not been intentionally and thoughtfully designed for the advantages and disadvantages such roles bring. Specifically, staff hired from field-based roles typically have strong clinical expertise, ecosystem and business acumen, selling and coaching skills, but rarely have any instructional design, learning technology or operations experience. For speed to impact, these roles should have internal enablement support to minimize the need to select and manage vendors, create content and workshops, and master principles of adult learning and instructional design.
We conduct an exercise asking respondents to imagine they are hired to establish a brand new learning and development team. Where would they start? What capabilities would be at the core? Which capabilities are mostly execution or implementation? In between core and execution, there are often ignored enablement capabilities. Only after mapping out these three capability functions can teams and processes be built.
If any of these examples or findings resonate with you, you might be guilty of operating by org chart. Instead of shuffling boxes around a page, redesign teams to create value to the organization. It might be time to resume power over your org chart by identifying core, enablement and execution capabilities and only then assigning processes and people to deliver impact.
Kristin Scott is director, L&D solutions, for TGaS Advisors, division of Trinity Life Sciences. Email Kristin at kscott@trinitylifesciences.com.